
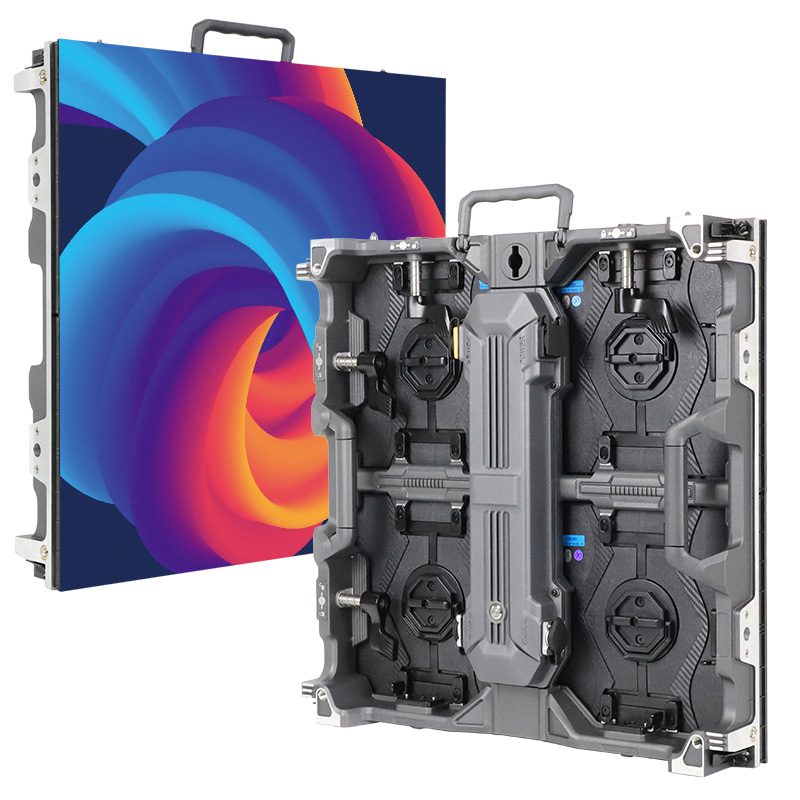
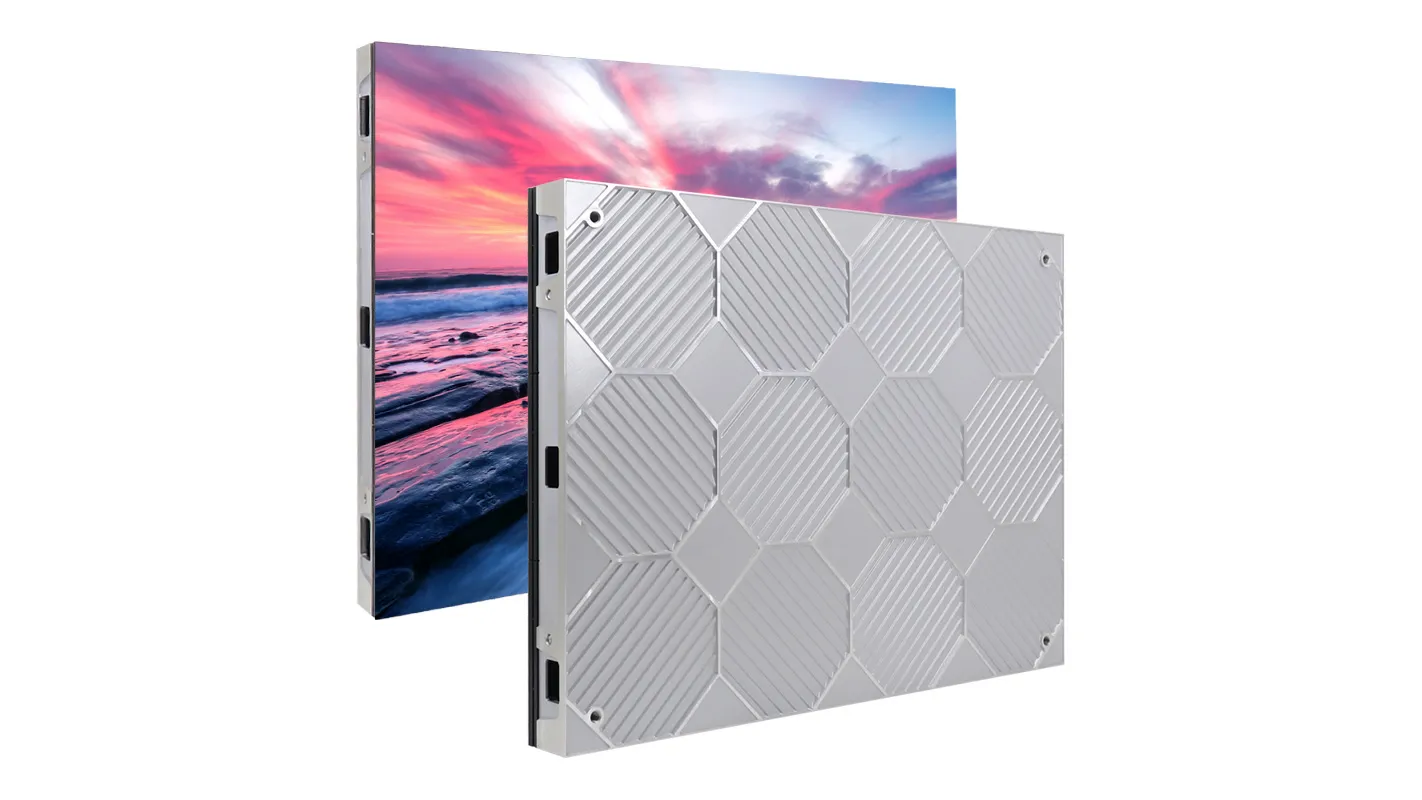
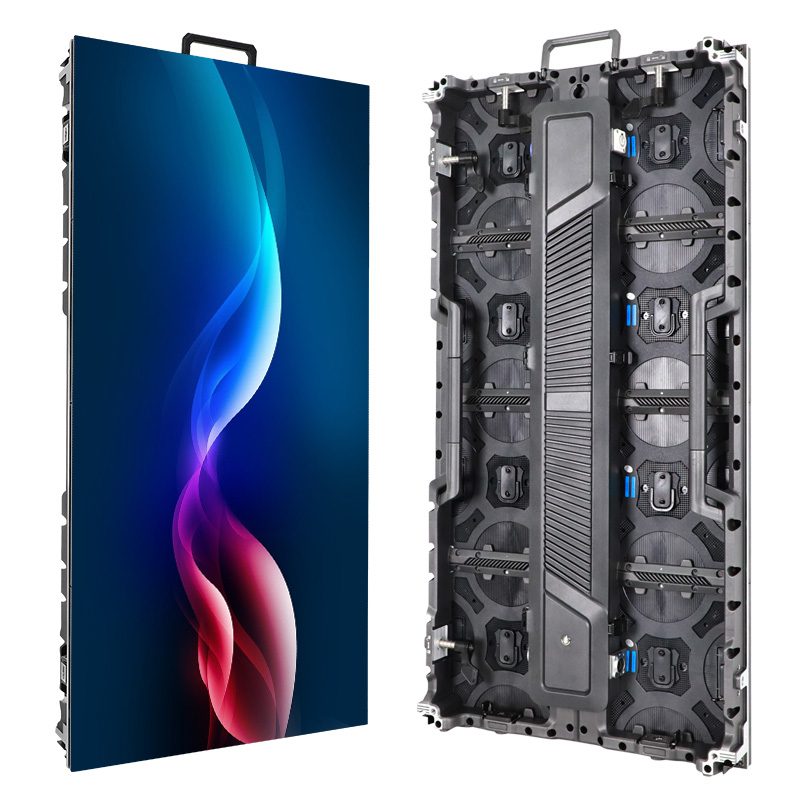
An energy efficient LED screen should use less measured electrical power while meeting the same viewing requirements. Compare screens at the same area, brightness, content and operating schedule. A product label, pixel pitch or “typical power” figure alone cannot tell you the annual electricity bill.
This guide shows B2B buyers how to compare LED display power consumption, calculate running costs and request evidence before ordering an energy saving LED screen.
Same brightness, playlist and active screen area.
Use operating power and actual hours, including standby.
Separate cabinet power, control equipment and site cooling.
1. How much power does an LED screen use?
There is no single reliable W/m² figure for every indoor or outdoor LED display. Configuration, luminance, image content, power supply losses and operating conditions all affect consumption. Use the current specification for the exact model and ask how each figure was obtained.
On smaller screens, swipe within the table to see all columns.
| Figure | What it tells you | What to verify |
|---|---|---|
| Maximum input power | The manufacturer’s stated upper operating load for the configuration. | Test pattern, brightness, input voltage and whether controls are included. |
| Typical or average power | A result under a particular content and settings profile. | The playlist, measured brightness, test duration and ambient conditions. |
| Measured project power | Real power at the agreed electrical measurement boundary. | True-power meter, included equipment and representative operating periods. |
| Standby power | Consumption when the image is off but equipment remains powered. | Cabinets, player, processor, network equipment and control settings. |
Watts and kilowatts describe power; kilowatt-hours describe energy over time. Convert W/m² to kW by multiplying by active display area and dividing by 1,000. If a supplier gives watts per cabinet, multiply by the cabinet count instead. Do not multiply by area a second time.
Do not assume that average power is always a fixed percentage of maximum. Electrical distribution also needs the manufacturer’s load data, inrush information, power factor, phase arrangement and local design requirements. Have the qualified installer size the supply; a running-cost estimate is not a circuit design.
2. LED screen electricity cost: a worked example
Annual energy = operating power × operating hours + standby power × standby hours. For changing brightness schedules, calculate each operating period separately and add the results. Apply the relevant electricity tariff to each period if prices vary by time of use.
Illustrative calculation only: the figures below are assumptions for explaining the method. They are not EagerLED test results, a product specification, a regional tariff benchmark or a savings promise.
| Assumption or result | Option A | Option B |
|---|---|---|
| Screen area | 12 m² | 12 m² |
| Assumed average power at matched settings | 200 W/m² | 150 W/m² |
| Operating power | 2.4 kW | 1.8 kW |
| Schedule | 10 hours/day, 300 days/year | Same schedule |
| Annual operating energy | 7,200 kWh | 5,400 kWh |
| Assumed energy tariff | USD 0.15/kWh | USD 0.15/kWh |
| Annual operating electricity cost | USD 1,080 | USD 810 |
In this example, the difference is 1,800 kWh or USD 270 per year. Standby energy, external controls, air conditioning, demand charges, taxes and maintenance are excluded. Add those items only with project-specific evidence. Replace every assumed input before making a purchasing decision.
If the equipment premium were USD 900, electricity-only simple payback would be 900 ÷ 270 = approximately 3.3 years under these assumptions. A shorter schedule or lower tariff extends that period. Compare the full quoted ownership costs rather than accepting a universal payback claim.
3. What makes an energy saving LED screen more efficient?
Drive circuit and power supply design
Appropriately matched LED supply voltages and driver circuitry can reduce electrical losses. Common-cathode designs may enable different supply voltages for the colour channels, but the implementation matters. Ask for the actual driver IC, power supply model and matched-condition measurements. The architecture name alone does not establish a savings percentage.
Power supply conversion efficiency and power factor are different properties. Efficiency concerns AC-to-DC losses; power factor relates real power to apparent power. A higher power factor is not, by itself, proof of lower billed kWh. Compare documented performance at the intended load and use the applicable utility tariff.
Brightness control and operating schedule
Choose sufficient brightness for the installation, then commission suitable day and night settings. A light sensor or schedule can prevent unnecessary output, provided the display remains readable and meets local brightness requirements. See our LED display brightness guide.
Module packaging is not an energy rating
COB, GOB and SMD describe packaging approaches. They should not be treated as guaranteed electricity savings. Evaluate protection, repair method, optical performance and power for the exact configuration. Our SMD versus COB comparison and GOB module guide explain the packaging choices.

4. Heat, ventilation and air-conditioning costs
Do not apply a fixed “half becomes heat” rule or automatically add a fixed percentage for air conditioning. Heat released into a room depends on the equipment, installation boundary, emitted light and heat paths. Outdoor exposure and solar gain also affect thermal conditions.
Request the manufacturer’s heat-dissipation data for the selected configuration. For conditioned rooms, give the HVAC designer the cabinet location, operating profile, external power supply location and expected heat load. Cooling electricity depends on the building’s system and operating conditions, so show it separately from display electricity.
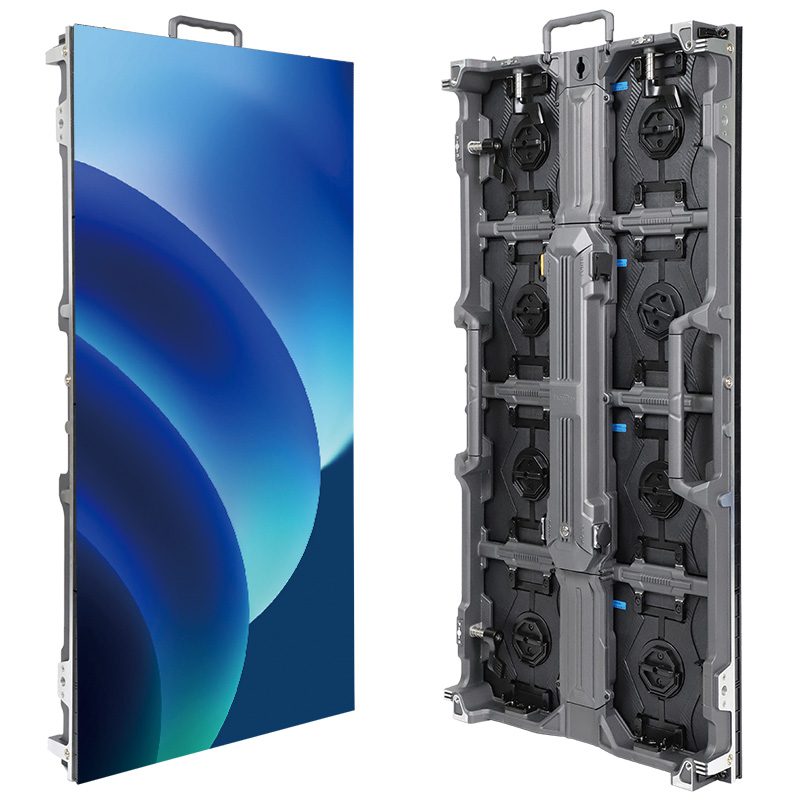
The EA960F4 outdoor advertising screen, for example, uses aluminum modules, fans and a thermal path involving the cabinet door. This is a cooling-design example, not evidence that every configuration is fanless or achieves a particular saving. Keep approved airflow paths clear; never disable fans or change thermal protection to reduce power.
5. How to compare LED screen quotations fairly
Send each supplier the same brief. Require a named model and configuration, and distinguish a supplier’s estimate from a measured acceptance result.
| Comparison item | Evidence to request |
|---|---|
| Equal visual task | Active area, pixel pitch, calibrated brightness, colour settings and the same sample playlist. |
| Electrical boundary | Complete cabinet AC input; identify any separately measured processors, players, fans or remote supplies. |
| Repeatable measurement | Supply voltage, ambient conditions, warm-up period, test duration, true-power readings and kWh over the content cycle. |
| Operating profile | Day/night settings, operating days, off/standby schedule and automatic-dimming scope. |
| Installation and service | Maximum load, heat data, ventilation clearance, access route, spare parts and warranty scope. |
| Commercial comparison | Equipment premium, local tariff and separately itemized installation, controls and cooling costs. |
During acceptance, repeat the agreed playlist at the specified brightness and record kWh over a representative cycle. Keep the meter record, settings and configuration together. If one offer is measured at lower brightness or excludes its external power supply, the two power figures are not directly comparable.

6. Reduce power on an existing LED display
- Measure the baseline. Record brightness, content, schedule and complete-system kWh before changing settings.
- Correct unnecessary brightness. Test readability in actual daylight and after dark; retain approved limits and sensor fail-safe settings.
- Review off-hours operation. Use manufacturer-approved start/stop schedules. A black image may leave power supplies and controls running.
- Test suitable content. Darker creative may reduce consumption on a direct-view LED screen, but preserve legibility and measure the actual playlist.
- Maintain the thermal design. Clean and inspect according to the manufacturer’s procedure. Do not obstruct ventilation or substitute unapproved fans and supplies.
- Recheck the result. Compare energy over the same operating period and visual conditions, rather than adding unrelated advertised savings percentages.
Do not lower refresh rate solely on the assumption that halving the refresh setting halves power. Driver implementation, image quality and camera requirements matter. Use approved settings and verify the result; our LED refresh rate guide covers display-quality considerations.
7. Choose a display for the application first
For fixed outdoor advertising, review the EA960F4 against your brightness, service-access and environmental requirements. For event rental, compare the EA640C3 rental display with the handling and installation needs of your fleet. If COB packaging is relevant, review the EA600COB3 for the intended viewing conditions.
These are different product families, not an energy-efficiency ranking. Request the current configuration’s maximum and typical input power, the measurement conditions and the proposed control system before comparing costs.
Request a project-specific power comparison
Send screen width and height, indoor/outdoor location, viewing distance, country, daily operating hours, content type and purchase timing. Add your local electricity tariff and day/night brightness requirements if available. Ask for a configuration-specific quote with power assumptions and included equipment clearly identified.
8. Energy efficient LED screen FAQs
Is a common-cathode LED screen always more efficient?
No universal saving follows from the label. Compare the complete system at the same brightness, area and content, using the selected configuration’s measurements.
Can I use maximum power to estimate the annual bill?
It can describe an upper-load scenario if its conditions are understood, but representative measured power and the actual schedule give a more useful operating budget. Keep maximum-load electrical design separate.
Does a smaller pixel pitch always mean higher consumption?
Pixel density alone is insufficient. LED characteristics, drive circuitry, brightness, content and system losses also matter. Compare W/m² under matched conditions.
Are COB and GOB screens guaranteed to save electricity?
No. Packaging is not an energy rating. Request measured power for the exact model and settings rather than assigning a fixed saving to a packaging type.
Is a fanless LED cabinet always the best choice?
It avoids fan power, but must still satisfy the required brightness, ambient-temperature and installation conditions. Choose a validated thermal design rather than removing required cooling.
Will an energy saving LED display pay for itself in one year?
That depends on the price premium, verified consumption difference, schedule and tariff. Calculate the project’s electricity-only payback separately from maintenance and other ownership costs.
 EagerLED Dragon Boat Festival Holiday Notice 2025
 How to Choose the Best LED Refresh Rate: 1920Hz vs 3840Hz vs 7680Hz